
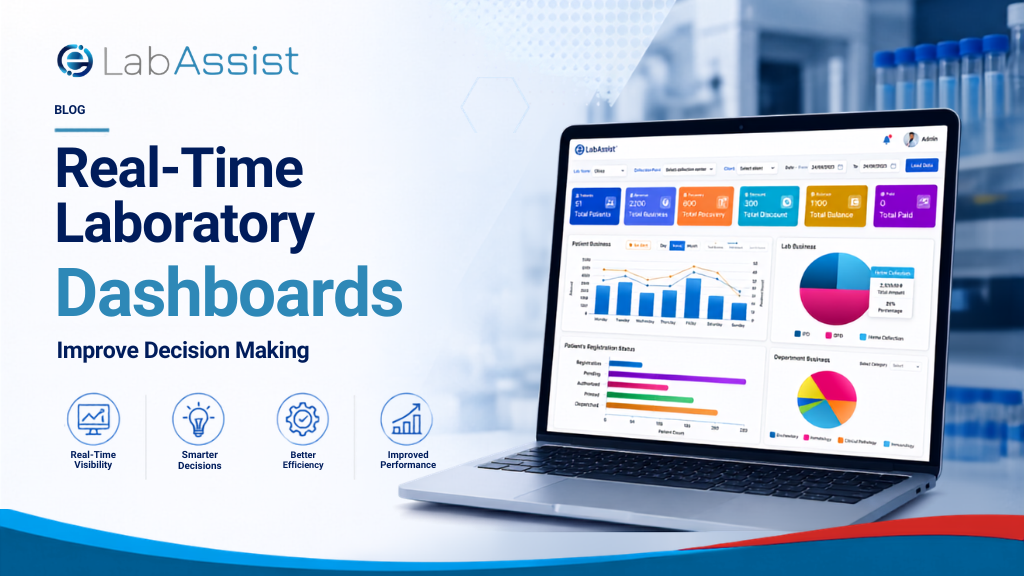
Real-Time Laboratory Dashboards Improve Decision Making
August 3, 2026
In today’s diagnostic and clinical laboratory environment, success depends on more than delivering accurate test results. Laboratory leaders must continuously monitor performance, manage growing workloads, ensure compliance, optimize resources, and deliver faster turnaround times—all while controlling operational costs.
Traditional reports generated at the end of the day or week are no longer sufficient. By the time issues become visible, they have often already affected productivity, patient care, or profitability.
This is why modern laboratories are increasingly adopting real-time laboratory dashboards as part of their Laboratory Information Management System (LIMS). These dashboards provide instant visibility into laboratory operations, allowing decision-makers to identify problems early, allocate resources effectively, and improve overall performance.
This article explores why real-time laboratory dashboards have become an essential tool for laboratory directors and operations managers.
What Is a Real-Time Laboratory Dashboard?
A real-time laboratory dashboard is a centralized visual interface that displays live operational data collected from every stage of the laboratory workflow.
Instead of relying on static reports, dashboards continuously update key performance indicators (KPIs), enabling laboratory managers to make informed decisions throughout the day.
Common dashboard metrics include:
- Sample volumes
- Pending tests
- Turnaround Time (TAT)
- Instrument utilization
- Staff productivity
- Quality control status
- Rejected samples
- Critical alerts
- Revenue indicators
- Department-wise workload
Rather than searching through multiple reports, managers gain a complete operational overview from a single screen.
Why Traditional Reporting Is No Longer Enough
Many laboratories still depend on manually prepared spreadsheets or end-of-day reports.
While these reports provide historical insights, they don’t help teams respond to problems as they happen.
Consider these scenarios:
- A chemistry analyzer suddenly develops a backlog.
- Sample rejection rates increase unexpectedly.
- One phlebotomy center experiences unusually high patient volumes.
- Turnaround time begins slipping during peak hours.
If these issues are identified only after daily reporting, valuable time has already been lost.
Real-time dashboards enable laboratories to detect operational bottlenecks immediately and take corrective action before service quality is affected.
Benefits of Real-Time Laboratory Dashboards
1. Complete Operational Visibility
Laboratory directors need a clear understanding of everything happening across the organization.
Real-time dashboards consolidate data from multiple departments into one centralized interface, providing visibility into:
- Sample collection
- Sample processing
- Analyzer status
- Reporting queues
- Quality control
- Inventory
- Workforce utilization
Instead of contacting individual departments for updates, managers can monitor the entire laboratory in seconds.
2. Faster Decision Making
Modern laboratories generate thousands of data points every day.
The challenge is not collecting data—it’s acting on it quickly.
Real-time dashboards empower laboratory managers to:
- Prioritize urgent samples
- Redistribute workload
- Resolve bottlenecks
- Manage instrument downtime
- Increase staffing during busy periods
Rather than making assumptions, decisions are based on current operational data.
3. Improved Turnaround Time (TAT)
Turnaround time remains one of the most important performance indicators for diagnostic laboratories.
Delayed reports can affect:
- Patient satisfaction
- Physician confidence
- Laboratory reputation
- Revenue
Real-time dashboards continuously monitor TAT across every department.
Managers can instantly identify:
- Delayed samples
- Overloaded analyzers
- Pending validations
- Reporting bottlenecks
Addressing these issues proactively helps laboratories consistently meet service-level commitments.
4. Better Resource Utilization
Laboratories often struggle with balancing workload across staff and equipment.
Without visibility, some departments become overloaded while others remain underutilized.
Real-time dashboards provide insights into:
- Technician productivity
- Analyzer utilization
- Department workload
- Shift performance
- Sample distribution
This enables smarter resource allocation without increasing operational costs.
5. Early Identification of Operational Bottlenecks
Small workflow issues can quickly grow into major operational challenges.
Examples include:
- Delayed barcode scanning
- Instrument maintenance
- QC failures
- Sample transportation delays
- Validation queues
Real-time alerts notify managers immediately when predefined thresholds are exceeded.
This proactive approach minimizes disruptions before they impact laboratory performance.
6. Enhanced Quality Management
Quality assurance is critical in every accredited laboratory.
Dashboards help monitor quality indicators such as:
- QC status
- Calibration schedules
- Sample rejection rates
- Critical value reporting
- Repeat testing frequency
- Error trends
Instead of reacting during audits, laboratories continuously monitor quality metrics throughout daily operations.
7. Data-Driven Workforce Management
Staff scheduling often relies on historical assumptions.
Real-time dashboards reveal actual workload patterns by displaying:
- Samples received per hour
- Peak testing periods
- Department performance
- Technician productivity
- Pending workload
Managers can optimize staffing based on real demand, reducing overtime while maintaining efficiency.
8. Smarter Business Decisions
Laboratory dashboards extend beyond operational metrics to provide valuable business intelligence.
Leadership teams can track:
- Revenue trends
- Test volumes
- Department profitability
- Referral center performance
- Customer growth
- Test mix analysis
These insights support strategic planning, budgeting, expansion, and investment decisions.
Key Metrics Every Laboratory Dashboard Should Include
An effective dashboard should provide actionable insights rather than overwhelming users with excessive information.
Essential KPIs include:
- Daily sample volume
- Test completion rate
- Average turnaround time
- Pending reports
- Analyzer utilization
- Instrument downtime
- Quality control compliance
- Sample rejection percentage
- Technician productivity
- Inventory status
- Revenue per department
- Referral laboratory performance
- Critical alerts
- SLA compliance
The most effective dashboards allow users to customize views based on their role and responsibilities.
The Role of LIMS in Real-Time Dashboard Reporting
A Laboratory Information Management System serves as the foundation for real-time dashboards.
As samples move through the laboratory, the LIMS continuously collects operational data from:
- Registration
- Barcode generation
- Sample tracking
- Analyzer integration
- Quality control
- Validation
- Reporting
- Billing
This centralized data enables dashboards to present an accurate, real-time view of laboratory performance.
When integrated with analyzers and middleware, dashboard information updates automatically without manual intervention.
Real-World Example
Imagine a multi-location diagnostic laboratory processing 8,000 samples daily.
Without a dashboard:
- Managers discover delays only after customer complaints.
- Staff shortages remain unnoticed until turnaround times increase.
- Instrument failures create hidden backlogs.
- Operational reports are available only at day’s end.
With a real-time dashboard:
- Delays are detected within minutes.
- Managers immediately redistribute workload.
- Instrument downtime triggers alerts.
- High-priority samples are monitored continuously.
- Daily operations remain under control.
The result is faster reporting, improved efficiency, and higher customer satisfaction.
Choosing the Right Laboratory Dashboard
When evaluating laboratory software, consider whether the dashboard provides:
- Real-time updates
- Customizable KPIs
- Department-wise reporting
- Multi-branch visibility
- Interactive charts and graphs
- Role-based access
- Mobile accessibility
- Automated alerts
- Historical trend analysis
- Business intelligence reporting
The dashboard should simplify decision-making rather than add complexity.
How eLabAssist Helps Laboratories Gain Real-Time Visibility
Modern laboratories require more than basic reporting—they need actionable intelligence.
eLabAssist LIMS offers powerful real-time dashboards that provide complete visibility across laboratory operations.
Key capabilities include:
- Live operational dashboards
- Turnaround time monitoring
- Sample tracking
- Analyzer integration
- Productivity analytics
- Multi-location reporting
- Quality management insights
- Role-based dashboard access
- Operational alerts
- Business performance reporting
By transforming operational data into meaningful insights, eLabAssist enables laboratory leaders to improve efficiency, enhance quality, and make faster, evidence-based decisions.
Conclusion
In an increasingly competitive healthcare environment, laboratories cannot afford to rely on outdated reporting methods.
Real-time laboratory dashboards empower leaders with immediate access to operational insights, enabling faster responses, better resource utilization, improved quality, and enhanced business performance.
For laboratory directors and operations managers, dashboards are no longer just reporting tools—they are strategic assets that drive continuous improvement and informed decision-making.
Organizations that invest in real-time visibility are better positioned to deliver faster results, improve patient satisfaction, and maintain long-term operational excellence.
Frequently Asked Questions (FAQs)
1. What is a real-time laboratory dashboard?
A real-time laboratory dashboard is a visual interface that displays live operational data, including sample status, turnaround time, analyzer performance, quality metrics, and workload, enabling managers to monitor laboratory operations continuously.
2. How do laboratory dashboards improve decision-making?
They provide instant visibility into key performance indicators, helping managers identify bottlenecks, allocate resources efficiently, and respond to issues before they affect productivity or patient care.
3. What KPIs should every laboratory dashboard include?
Important KPIs include sample volume, turnaround time, pending reports, analyzer utilization, technician productivity, quality control status, sample rejection rate, inventory levels, and SLA compliance.
4. Can real-time dashboards help reduce turnaround time?
Yes. By identifying delays and bottlenecks as they occur, dashboards allow laboratories to take immediate corrective action, improving turnaround times and service quality.
5. How does a LIMS support real-time dashboards?
A LIMS automatically collects and updates data from sample registration, analyzer integration, quality control, reporting, and billing, ensuring that dashboards always display accurate, real-time information.